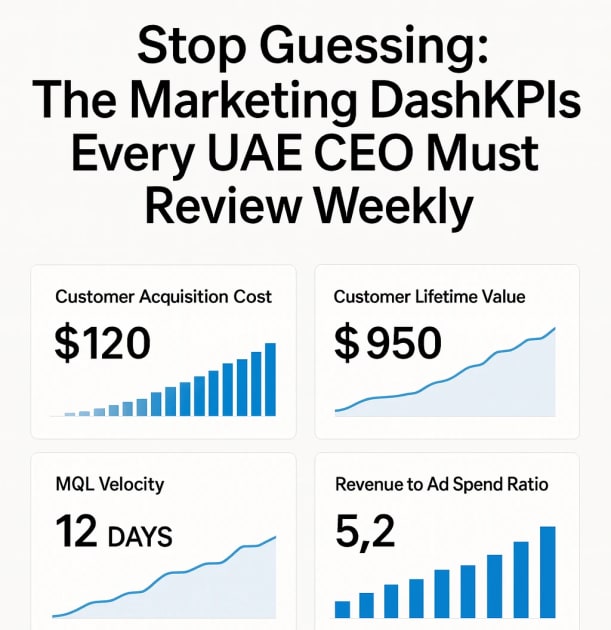
Stop Guessing: The Marketing Dashboard KPIs Every UAE CEO Must Review Weekly
As a CEO in the UAE, your time is a finite resource, and a 50-page marketing report is a time sink. You need clear, concise, actionable data that answers one fundamental question: Are we making money, and can we scale it? This means understanding not just what happened, but why it happened and what to do next.
Most marketing teams get bogged down in vanity metrics – likes, impressions, follower counts. These numbers might look good on a surface level, but they often lack a direct correlation to revenue. We cut through the noise and focus on the metrics that truly matter: the Revenue-Driving KPIs that directly impact your bottom line.
The Four Non-Negotiable KPIs for the C-Suite
These four KPIs provide a comprehensive overview of your marketing performance. They are the vital signs of your marketing engine, offering a clear picture of efficiency, sustainability, and scalability.
1. Customer Acquisition Cost (CAC)
What It Measures: The total cost incurred to acquire a new customer, calculated as: Total marketing and sales spend / Number of new customers acquired.
Why the CEO Cares (GCC Context):
-
Budget Efficiency: In the highly competitive and often high-cost GCC advertising market (especially in the UAE and Saudi Arabia), meticulous CAC monitoring is essential. Expect to pay a premium for visibility, especially in sectors like real estate and luxury goods. A lower CAC directly translates to higher profitability and a better return on investment.
-
Resource Allocation: Understanding your CAC allows you to make informed decisions about where to allocate your marketing budget. If one channel consistently yields a lower CAC, it deserves more investment.
-
Competitive Advantage: A lower CAC than your competitors gives you a significant advantage, allowing you to invest more in growth or offer more competitive pricing.
Example: A Dubai-based real estate company spends AED 500,000 on marketing in a quarter and acquires 50 new customers. Their CAC is AED 10,000. The CEO needs to know if this is acceptable compared to industry benchmarks and if there are ways to reduce it through more targeted campaigns or improved sales processes.
Actionable Tip: Segment your CAC by channel (e.g., paid social, search engine marketing, content marketing) to identify the most cost-effective acquisition strategies. Continuously A/B test your campaigns to optimize for lower CAC.
2. Customer Lifetime Value (CLV)
What It Measures: The predicted total revenue a single customer will generate for your business throughout their entire relationship with you. This calculation can vary based on the business model, but a common formula is: (Average Purchase Value x Purchase Frequency) x Customer Lifespan.
Why the CEO Cares (GCC Context):
-
Future-Proofing: CLV demonstrates the long-term value of your marketing strategy. If CLV is significantly greater than CAC (CLV >> CAC), you have a sustainable and profitable business model. This is particularly crucial in the GCC, where customer loyalty can be influenced by factors like cultural preferences and relationship-based sales.
-
Strategic Planning: Understanding CLV helps you determine how much you can afford to spend on acquiring new customers while maintaining profitability.
-
Customer Retention Focus: A high CLV emphasizes the importance of customer retention strategies. Investing in customer service, loyalty programs, and personalized experiences can significantly increase CLV.
Example: A luxury retail brand in Abu Dhabi finds that their average customer spends AED 5,000 per year and remains a customer for 5 years. Their CLV is AED 25,000. The CEO can use this information to justify investments in premium customer service and exclusive events to retain high-value clients.
Actionable Tip: Implement customer loyalty programs, personalize your marketing messages, and provide exceptional customer service to increase customer retention and boost CLV. Regularly analyze customer feedback to identify areas for improvement.
3. Marketing Qualified Lead (MQL) Velocity
What It Measures: The speed at which a lead progresses from being identified as a Marketing Qualified Lead (MQL) to becoming a Sales Qualified Lead (SQL). This is essentially the time it takes for marketing to nurture a lead to the point where it's ready for sales engagement.
Why the CEO Cares (GCC Context):
-
Sales Efficiency: A slow MQL velocity indicates a bottleneck in the B2B sales funnel, potentially costing you valuable deals. Time is money, especially in competitive markets like Dubai and Riyadh.
-
Marketing-Sales Alignment: A low velocity often points to a disconnect between marketing and sales. Improving communication and collaboration between these teams is crucial.
-
Lead Quality Assessment: A consistently slow velocity may suggest that your MQL criteria are too broad, resulting in leads that are not genuinely ready for sales.
Example: A B2B software company in Saudi Arabia notices that it takes an average of 60 days for an MQL to become an SQL. This is significantly longer than the industry average. The CEO needs to investigate the reasons for this delay, which could include poor lead nurturing, ineffective sales follow-up, or misalignment between marketing and sales qualification criteria.
Actionable Tip: Implement a robust lead nurturing program with personalized content tailored to each stage of the buyer's journey. Regularly review and refine your MQL and SQL definitions to ensure alignment between marketing and sales.
4. Revenue to Ad Spend Ratio (ROAS)
What It Measures: The amount of revenue generated for every dollar (or dirham, or riyal) spent on advertising. Calculated as: Revenue generated from advertising / Ad spend.
Why the CEO Cares (GCC Context):
-
Scaling: A high and consistent ROAS provides the CEO with the confidence to increase the advertising budget for aggressive growth. This is particularly important in the GCC, where rapid expansion is often a key strategic objective.
-
Campaign Effectiveness: ROAS provides a clear indication of the effectiveness of your advertising campaigns. It allows you to identify which campaigns are generating the most revenue and which ones need to be optimized or discontinued.
-
Profitability: A healthy ROAS ensures that your advertising investments are contributing to your bottom line.
Example: An e-commerce company in Qatar spends AED 100,000 on Google Ads and generates AED 500,000 in revenue. Their ROAS is 5:1. The CEO can confidently increase the Google Ads budget, knowing that for every dirham spent, they are generating five dirhams in revenue.
Actionable Tip: Track ROAS for each advertising channel and campaign. Use A/B testing to optimize your ads for higher conversion rates and lower costs. Focus on targeting the right audience with the right message.
Building a Holistic Measurement Framework
At Red Dot, we understand that relying solely on "last-click attribution" provides an incomplete and often misleading picture of marketing performance. Customers interact with your brand across multiple touchpoints before making a purchase. Therefore, we implement holistic measurement frameworks that triangulate data across your advertising platforms (Google Ads, Facebook Ads, etc.), CRM (Customer Relationship Management system), and Google Analytics. This comprehensive approach provides a true understanding of which channels – PR, content marketing, paid advertising – are actually driving profit and influencing customer behavior.
For example, a customer might first see your brand mentioned in a press release (PR), then click on a link in a social media post (content marketing), and finally convert after seeing a retargeting ad (paid advertising). Last-click attribution would only credit the paid ad, ignoring the influence of the earlier touchpoints. A holistic framework, on the other hand, would recognize the contribution of each channel to the overall customer journey.
The Red Dot Takeaway
We build customized dashboards that provide the C-suite with clear, real-time insights into the KPIs that matter most. These dashboards are designed to be intuitive and easy to understand, allowing for quick, data-led decisions in a fast-moving economy. We understand the unique challenges and opportunities of the GCC market, and our solutions are tailored to meet your specific needs and objectives.
"In God we trust, all others bring data." - W. Edwards Deming
Let Us Build Your Custom Growth Dashboard
Industry Benchmark: According to MarketingProfs, the average ROAS for Google Ads in the GCC region is 3:1 [The State of Marketing 2022].
🎯 Key Takeaways
- Focus on Revenue-Driving KPIs: CAC, CLV, MQL Velocity, and ROAS.
- Understand the GCC context: Consider cultural preferences, relationship-based sales, and high-cost advertising markets.
- Implement holistic measurement frameworks: Triangulate data across advertising platforms, CRM, and Google Analytics.
Frequently Asked Questions
What are the most important marketing KPIs for UAE CEOs?
The four non-negotiable KPIs for UAE CEOs are Customer Acquisition Cost (CAC), Customer Lifetime Value (CLV), Marketing Qualified Lead (MQL) Velocity, and Revenue to Ad Spend Ratio (ROAS).
Why is CAC important in the GCC market?
CAC is crucial in the GCC market due to the highly competitive and often high-cost advertising environment. A lower CAC directly translates to higher profitability and a better return on investment.
How can I improve my MQL velocity?
Implement a robust lead nurturing program with personalized content tailored to each stage of the buyer's journey. Regularly review and refine your MQL and SQL definitions to ensure alignment between marketing and sales.
Sources & References
Methodology: This article synthesizes information from industry reports, platform documentation, and our agency's direct experience managing digital campaigns in the UAE and GCC region.
Get Free Consultation
Let us build your custom growth dashboard and provide clear, real-time insights into the KPIs that matter most.
Get StartedLast reviewed: March 2024. This article is regularly updated to reflect the latest industry developments and platform changes.